November 16, 2026
Weed flush vs crop stress: reading RGB UAV imagery at leaf scale
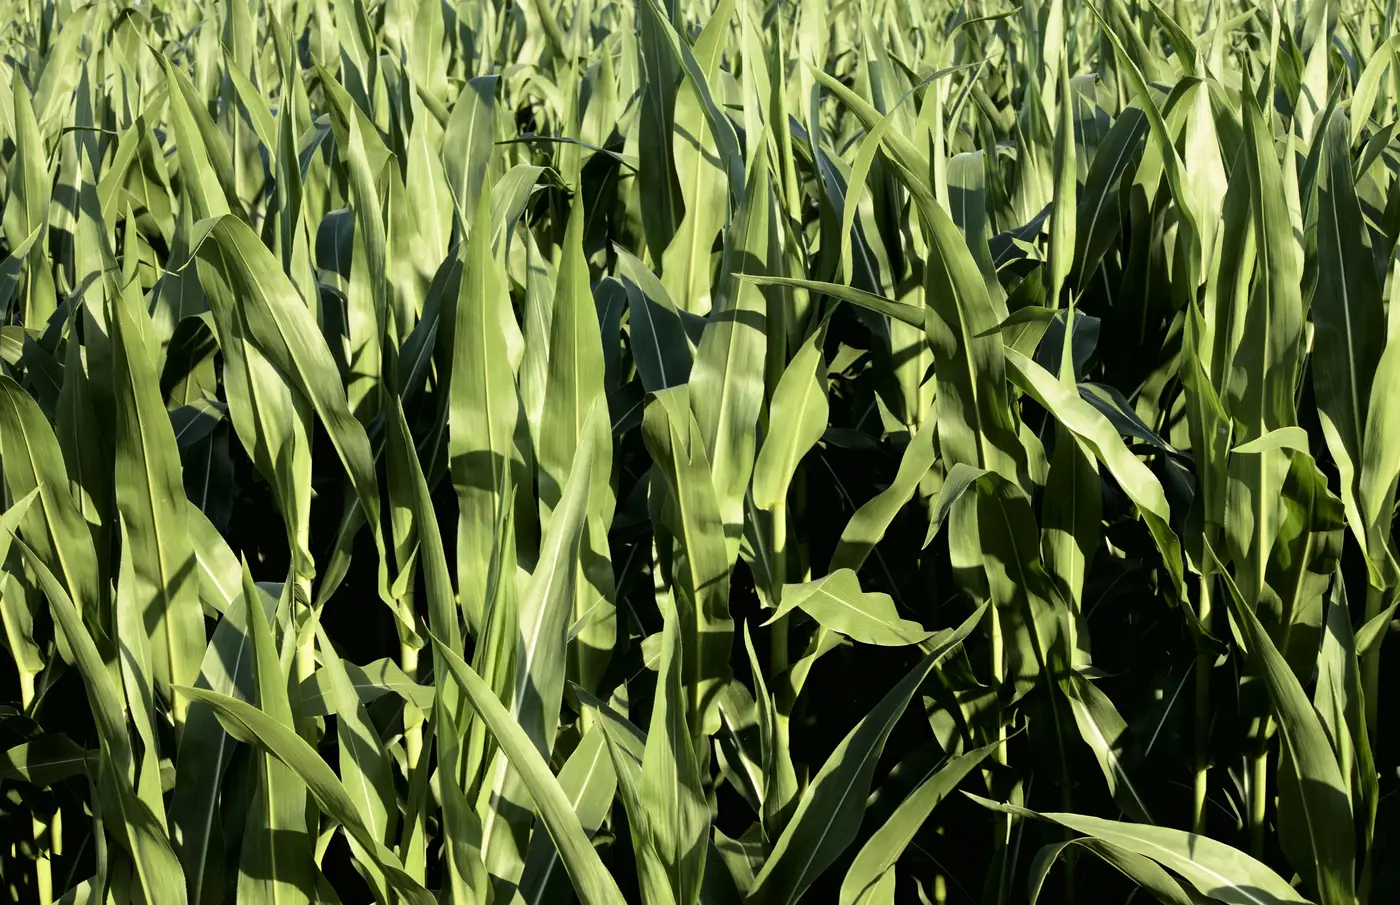
Every spray season somebody on the crew flags a field and says "that patch doesn't look right," and half the time it turns out to be a weed flush, the other half it's crop stress from compaction, drainage, or a nutrient gap. From a truck window or a coarse satellite pass they can look identical: a duller, patchier zone against an otherwise even stand. Get that call wrong and you skip a patch that needed treating, or you spend chemical and labor on a drainage problem that no herbicide pass will fix.
What separates the two is the cause behind the color shift, and that only shows up once you can see individual leaves.
Why flush and stress look the same from altitude
At typical scouting altitude, or on a coarse satellite image, you're looking at color and tone averaged across a few square meters at a time. Both a weed flush and a stressed patch of crop show up as a slightly different shade of green against the surrounding field. The eye, or a coarse vegetation index, reads "something's different here" without telling you what. That's the trap: a blanket-rate decision made off a tone difference you can't explain.
Crop stress tends to follow the field's own logic. It shows up in low spots that hold water, along compaction lines from last year's traffic, or in a gradient running off a drainage tile. The boundary is usually soft, the shape follows terrain or equipment paths, and every plant in the zone is still the crop, just smaller, paler, or set back a growth stage.
A weed flush follows the weed's own logic: where seed sat near the surface, where a wet spring triggered a germination window, where last year's spray missed a strip. The boundary is often sharper, because the "off" color you're seeing from altitude is a different plant species standing next to crop that's otherwise healthy.
What leaf-scale resolution shows you
Ground sample distance is what makes this call possible. At 2 cm per pixel or finer, the resolution you get flying UAV RGB imagery at normal spot-spray survey heights, individual leaf shapes, edges, and growth habit start to resolve. That level of detail separates one species from another, down to the leaf.
A few things to look for once you're at leaf scale:
Leaf shape and arrangement. Broadleaf weeds sitting inside a grass crop, or vice versa, show an obvious shape mismatch once you can see the individual leaf, not just the canopy texture. Crop stress never changes the leaf shape, it just changes how big or how pale the leaves are.
Growth habit and spacing. Crop rows hold their spacing even when stressed. Weeds don't care about the row. A cluster of plants sitting between rows, or crowding a row at an angle the crop was never planted at, is a strong tell regardless of color.
Edge geometry. Stress patches tend to fade in gradually, following soil or moisture boundaries. A weed patch at leaf scale has a rougher, more organic edge, a scatter of individual plants rather than a smooth tonal gradient.
Density within the patch. Weeds flush in clusters tied to seed deposition, so density inside the patch runs uneven: thick in spots, thin in others, with visible gaps between plants. Stressed crop holds full stand density, just under-performing.
None of this needs a spectral trick. It's RGB imagery read at the resolution where leaf-level detail is visible, which is the whole point of flying UAV passes at 2 cm GSD or finer instead of relying on a coarser aircraft or satellite pass for this call.
Putting it on the treat map
Once you can tell flush from stress at leaf scale, the spot-spray decision gets a lot more defensible. A patch map built off the current pass tells the sprayer which square meters are weed pressure, worth a section shutoff and a treatment, and which are crop stress that no herbicide will fix. The crew sprays the patch instead of the field, and the chemical spend lines up with ground that needs it this pass.
If you're scheduling this week's runs and want a patch map built straight off your own pass imagery instead of a tone-based guess, see how Weed Mapping handles it.